Predictive model evaluation -Gini Coefficient-
introduction
It is said that the model which is made by AI often becomes black boxes, but nowadays they are changing to a more descriptive form. WKWK also has a white box model that users can understand.
So how a risk model should be evaluated by when machine learning? In the case of credit scores, one of the representative indicators is the Gini Coefficient. In general consumer finance, the value varies greatly depending on the business model, such as 30% to 80%. It becomes one of the substantial reasons to say it is a credible model when the values are higher.
Let us explain what the Gini coefficient is.
What is Gini Coefficient?
The Gini Coefficient will be between 0.0 and 1.0, and will be 100% if the forecast and the actual result are in perfect agreement.
In other words, the closer the figure is to 100%, the higher the proportion of the forecast and the actual result is, and it can be said that the prediction model is effectively created, and the closer the value is to 0%, the more the forecast is in a random model.
Meaning of numerical values
The Gini Coefficient will be between 0.0 and 1.0, and will be 100% if the forecast and the actual result are in perfect agreement.
In other words, the closer the figure is to 100%, the higher the proportion of the forecast and the actual result is, and it can be said that the prediction model is effectively created, and the closer the value is to 0%, the more the forecast is in a random model.
How to calculate Gini Coefficient?
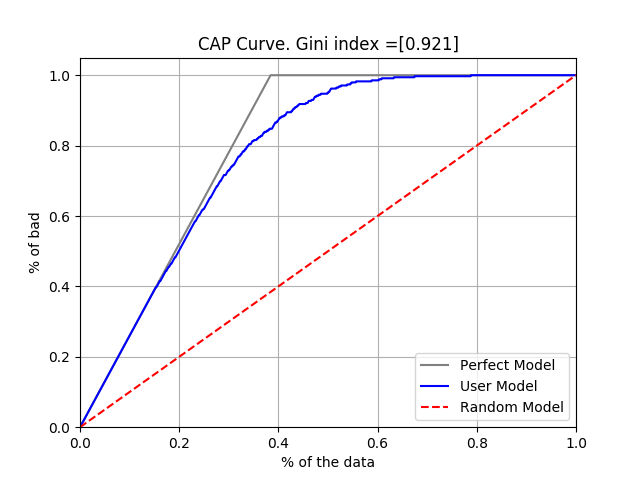
The Gini Coefficient is calculated using the area of the CAP curve (Cumulative Accuracy Profiles) = predictive model, fully predictive model, and model without predictive power = random model.
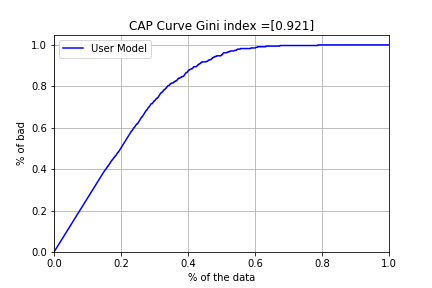
- The CAP curve is a curve in which the predicted models are arranged in descending order of probability of being overdue, and the cumulative ratio of all debtors is plotted on the X axis and the cumulative ratio of overdue is plotted on the y axis.
For example, in the graph below, 50% of all arrears occur at a point where the predicted arrears probability of all debtors is 20%. It will look like this.
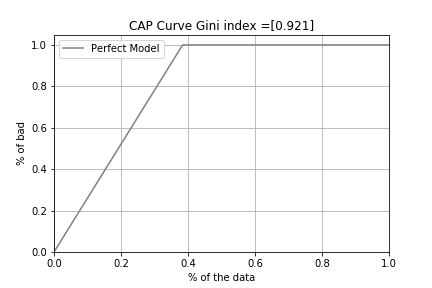
The Perfect model is a plot of “bad loans” first, followed by “Not bad loans”. It is a model that was able to fully predict that all the arrears occurred in the descending order of probability.
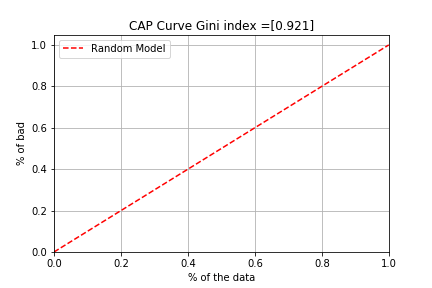
The model with no predictive power (Random model) draws a 45-degree line and has nothing to do with the predicted arrears rate and the actual arrears rate. For example, the model is such that the probability of delinquencies is arranged in descending order, 50% of all delinquencies are generated at 50% of all debtors.
Using the above three lines, the calculation formula is as follows.
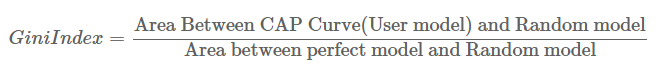
In other words, excluding the Random model part, having the area of the complete prediction model as 1, it is the ratio of how much the prediction model matches the complete prediction model.
Conclusion
As mentioned earlier, the Gini Coefficient, which is an important indicator in evaluating credit score models, is to evaluate ranking with a very easy-to-understand value.
However, the Gini Coefficient does not over all as it does not evaluate the predicted bad loans probability itself. Other indicators will be introduced in the future, so we hope you can use them as a reference for model evaluation.
Follow me!