Evaluation of Prediction Models – Logarithmic Loss –
Introduction
We would like to talk about logarithmic loss, or simply log loss this time. Similarly to Gini coefficient, log loss is one of the popular indexes used for determination in model development using machine learning. Though the calculation method is rather complicated compared to Gini coefficient, it would be sufficient if you could understand the meaning of the values as the actual calculation will be done by the machine. Let us begin with an explanation about what log loss is.
What is “Log Loss”?
Log loss is to quantify a gap between the predicted probability and its result using the cross entropy. The cross entropy is defined based on the information theory which allows to measure the accuracy of the predicted probability. In our previous blog, we explained the Gini coefficient shows the accuracy of the ranking of predicted probability. However, the accuracy of the predicted probability cannot be measured by the Gini coefficient. This is the reason why the log loss is used as one of the indexes. There is another index called Brier Score which we will explain in the future blog.
Meaning of Values
The value of log loss will get closer to zero “0” as the accuracy probability is higher and closer to one “1” as the accuracy probability deteriorates. Normally the prediction models for credit score use binary classification. The binary classification classifies events to be predicted into two categories and the probability of being classified in either category can be obtained. In the case when the classifications are defined as zero “0” being normal and one “1” as “nonperforming loan”, the value of log loss will be small if the probability of being classified as 1is high and the actual result shows 1. For example, if the predicted probability is 0.9 and the actual result is 1, you can imagine that the gap is small.
How to Calculate
The formula is as below. It may look rather complicated though the chances of doing manual calculation will be low as there are multiple calculation tools exist. The following is the formular for binary classification.
log: logarithm function
y: lable. Binary classification of 0 or 1.
p: predicted probability
−(𝑦log𝑝+(1−𝑦)log(1−𝑝))
As it is going to be a mean value,
−1𝑁∑𝑖=1𝑁((𝑦𝑖log𝑝𝑖+(1−𝑦𝑖)log(1−𝑝𝑖))
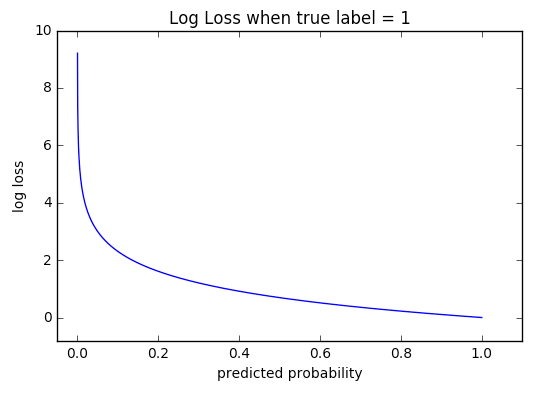
The following graph shows the log loss value when the result is classified as 1. When the predicted probability is calculated as low, meaning the prediction is incorrect, the value of the log loss will be large. When the value of the predicted probability is 0.2, the value of the log loss is almost 2, which means that the accuracy of the prediction is low. As the predicted probability gets closer to 1.0, the value of the log loss gets closer to 0.

Source: Wiki (http://wiki.fast.ai/index.php/Log_Loss)
Summary
- The log loss is to quantify the gap between the model predicted probability and the result. The closer the value is to 0, the better the model is.
- The evaluation will deteriorate when the predicted probability is considerably deviated. For example, 90% of people predicted as “performing loan” actually had an “nonperforming loan”, or 80% of people predicted as “nonperforming loan” actually was “performing loan”.
- The log loss is a similar index to brier score and can be the base for model development. When a high parameter needs to be adjusted, the minimum value of the log loss is often selected. The size of the value of the log loss cannot be compared to other data models.
- The size of the value of the log loss cannot be compared to other data models.
The log loss is a useful index to evaluate the accuracy of the predicted probability. Particularly in the case of credit score, as the risks will be controlled based on the predicted probability, it is important to classify not only to either normal or nonperforming loan, but also its size of the probability itself. The machine learning cannot evaluate by one index, however, the evaluation becomes more accurate when each of the roles are well understood.


